CASCA Map
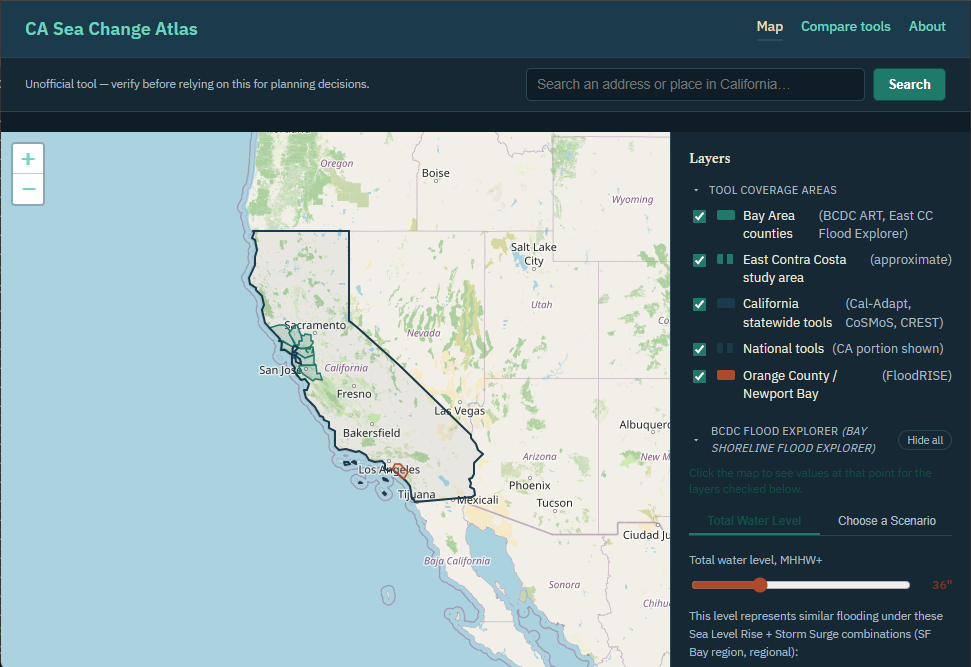
A Leaflet map with toggleable layers collated from the sea-level-rise and coastal-flooding mapping tools that have publicly accessible endpoints. Use this when you want to compare layers side-by-side and scenarios for a specific piece of California coastline. Not every resource appears here; see the comparison tool for the full list.
Open the mapCASCA County Profiles
Flood hazard, sea level rise, total economy and marine economy exposure for 27 California counties, rebuilding the function of NOAA's discontinued Coastal County Snapshots. Use this when you want to know what flooding and sea level rise mean for a specific county, with the source and the year each figure covers.
Find a county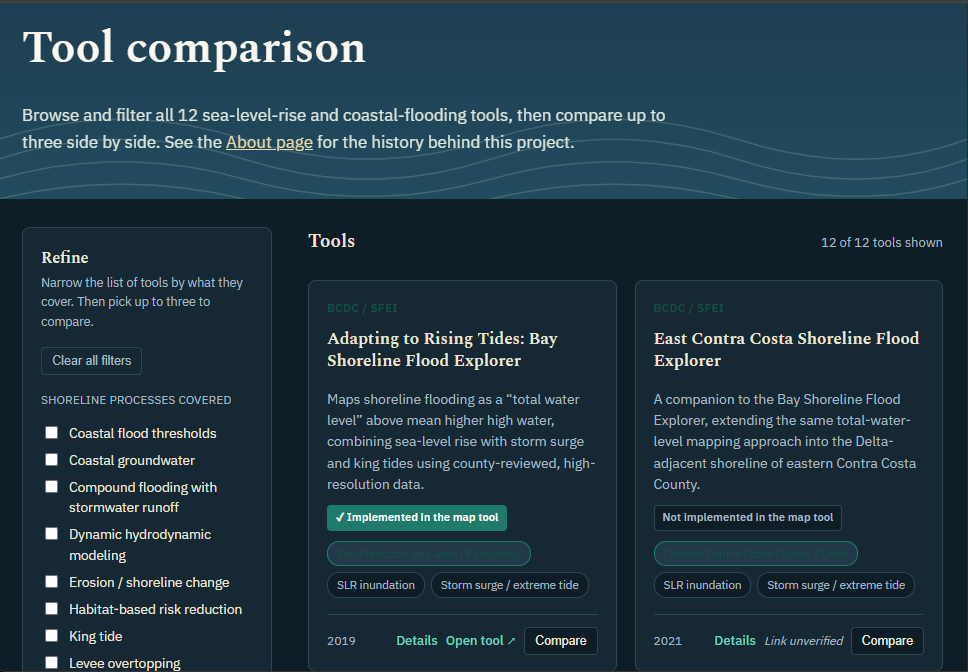
CASCA Comparison Tool
A filterable grid of sea-level-rise and coastal-flooding visualization resources California residents and planners might use, plus a compare-up-to-three table covering scope, process, exposure, data, and known limitations. Use this when you're deciding which tool can contribute to answering your question.
Browse the resources